3D Colormaps
In DICOM Studio, you can visualize image datasets through application of volumetric colormaps. These colormaps consist of a combination of color and opacity values designed to separate adjacent anatomical structures. There are two primary types:
- Adjustable Colormaps.
- Color Presets.
Adjustable Colormaps
Click the Apply Colormap button in the toolbar, with the icon below.
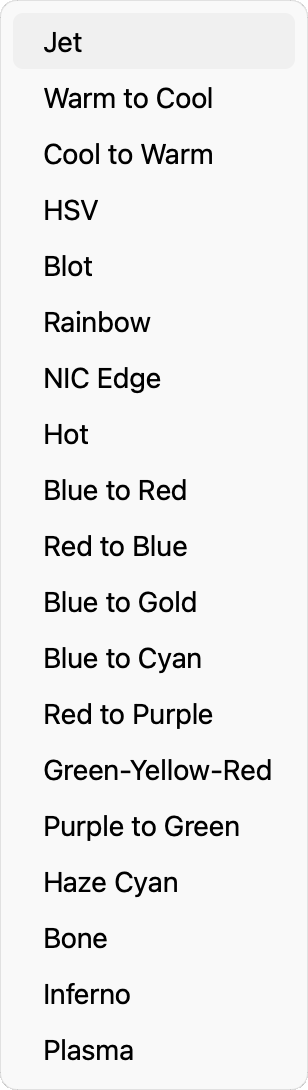
Pick a colormap from the menu that follows.
The colormap will instantly be applied to the volume.
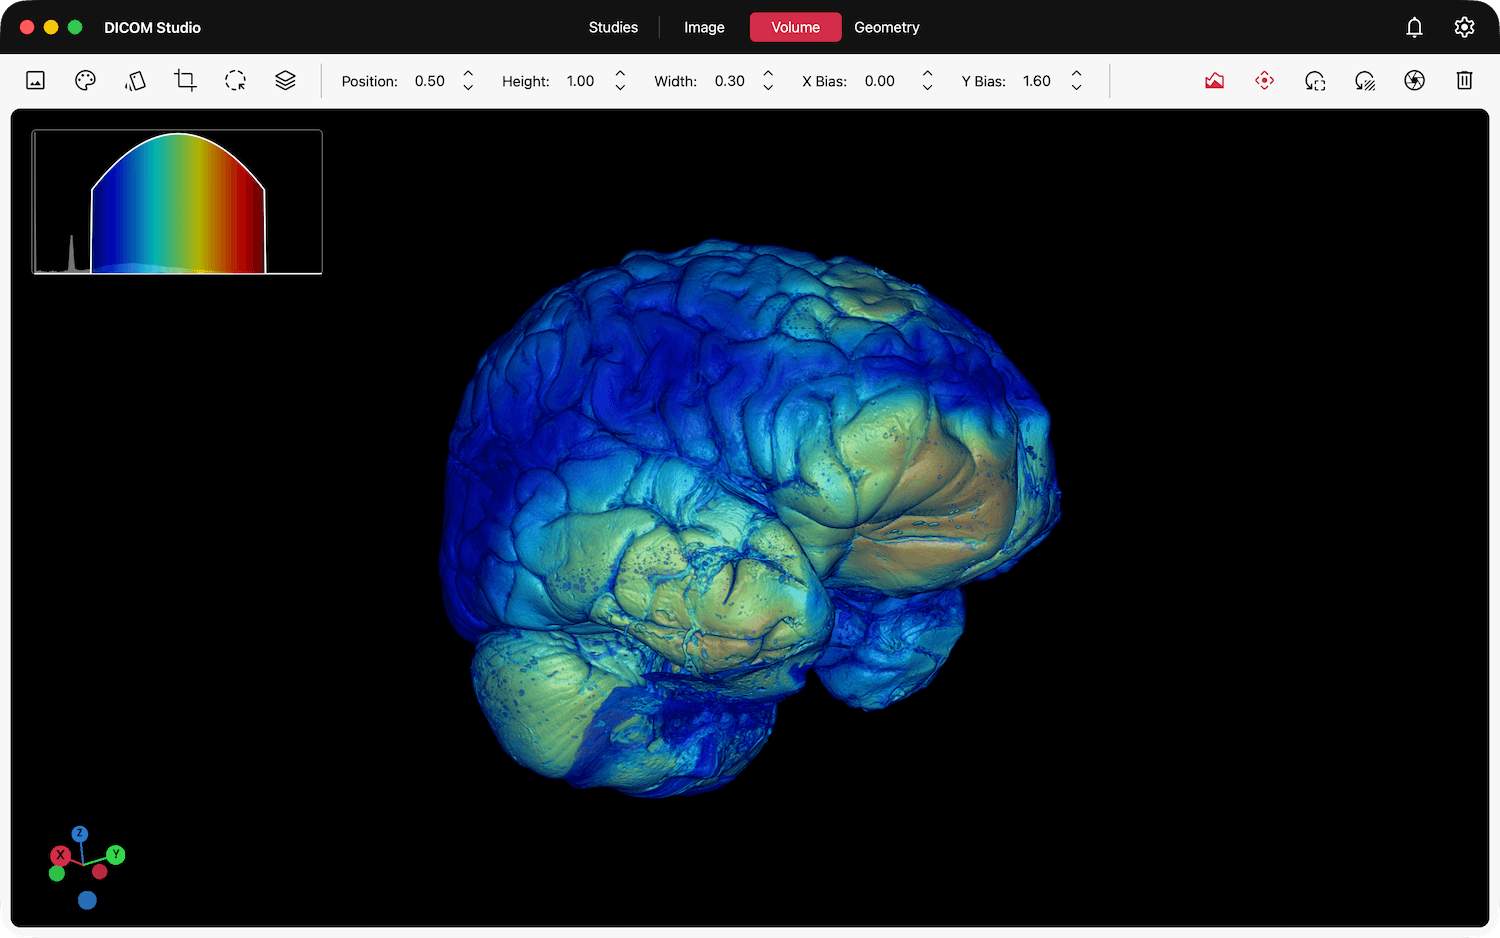
A Color • Opacity Distribution chart will be added to the graph widget in the top-left. In the example above, the Jet colormap was selected. Volume rendering works through application of Gaussian Functions. In this context, a Gaussian function is a mathematical representation used to model the opacity of values in the image dataset. So, for every color defined in the colormap, a corresponding opacity value is assigned based on the Gaussian function. This function is characterized by its bell-shaped curve, defined by its mean (or center), height (maximum value), width (spread), and biases, which can adjust its shape. Application of this function effectively allows for smooth transitions between transparent and opaque regions in the render.
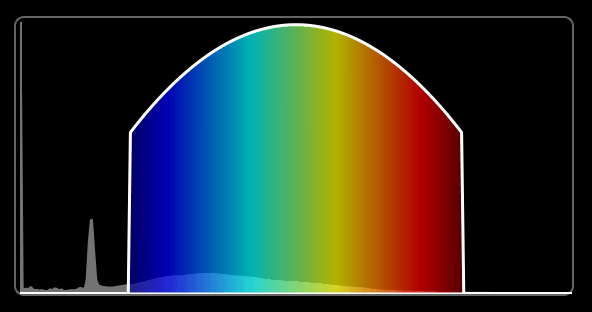
Note the shape of the curve in the chart. This is a visual representation of the active Gaussian function in the volume render. The peak represents an opacity of 1, and the valleys on each side represent the declining opacity all the way to 0 (transparent).
The graph also contains a histogram of the pixel values in your image dataset, represented by the light gray graph chart, just behind the bell curve. This histogram gives you a visual representation of the distribution of values in your dataset, and is very useful when customizing your volume render.
Use the widgets below, found in the toolbar, to visually control how different values in the volume are rendered.

A Gaussian function has four main characteristics, each of which can be can be adjusted as follows:
- Position: This parameter sets where on the range of image dataset's values the Gaussian's peak occurs. For instance, if you specify a position of 50, it means that at this value, the opacity will be at its maximum (determined by height).
- Height: The height parameter determines how opaque that point will be. A height of 1 means full opacity at that scalar value, while lower values indicate varying degrees of transparency.
- Width: This parameter affects how quickly the opacity transitions from opaque to transparent as you move away from the peak position. A larger width results in a smoother transition, while a smaller width creates a sharper drop-off in opacity. As a result, this parameter also affects what data is visible on the volume render.
- X & Y Biases: These parameters allow for adjustments to the Gaussian's shape, enabling asymmetrical curves that can better fit more complex data distributions.
Adjust these values, and the effect on the volume render will be calculated and displayed in real-time.
Colormap Scaling
Colormaps are scaled to fit in the width of the active Gaussian function by default. This allows the full spectrum of the colormap to be applied to the range of values that you specify. There may be instances where your focus is on a very small range of values, and application of the entire colormap will hinder the clarity of your volume render. In such cases, you can disable Colormap Scaling in the menubar under the Volume menu: Volume → Scale Volume Colormap. When disabled, the colormap will be applied evenly to the entire image dataset, irrespective of the width you set.
2D Image vs 3D Volume View
Click the Show Image View button in the toolbar, with the icon above, to open an Image View side by side, next to the Volume View. This allows you to directly compare your image dataset in 2D and 3D.
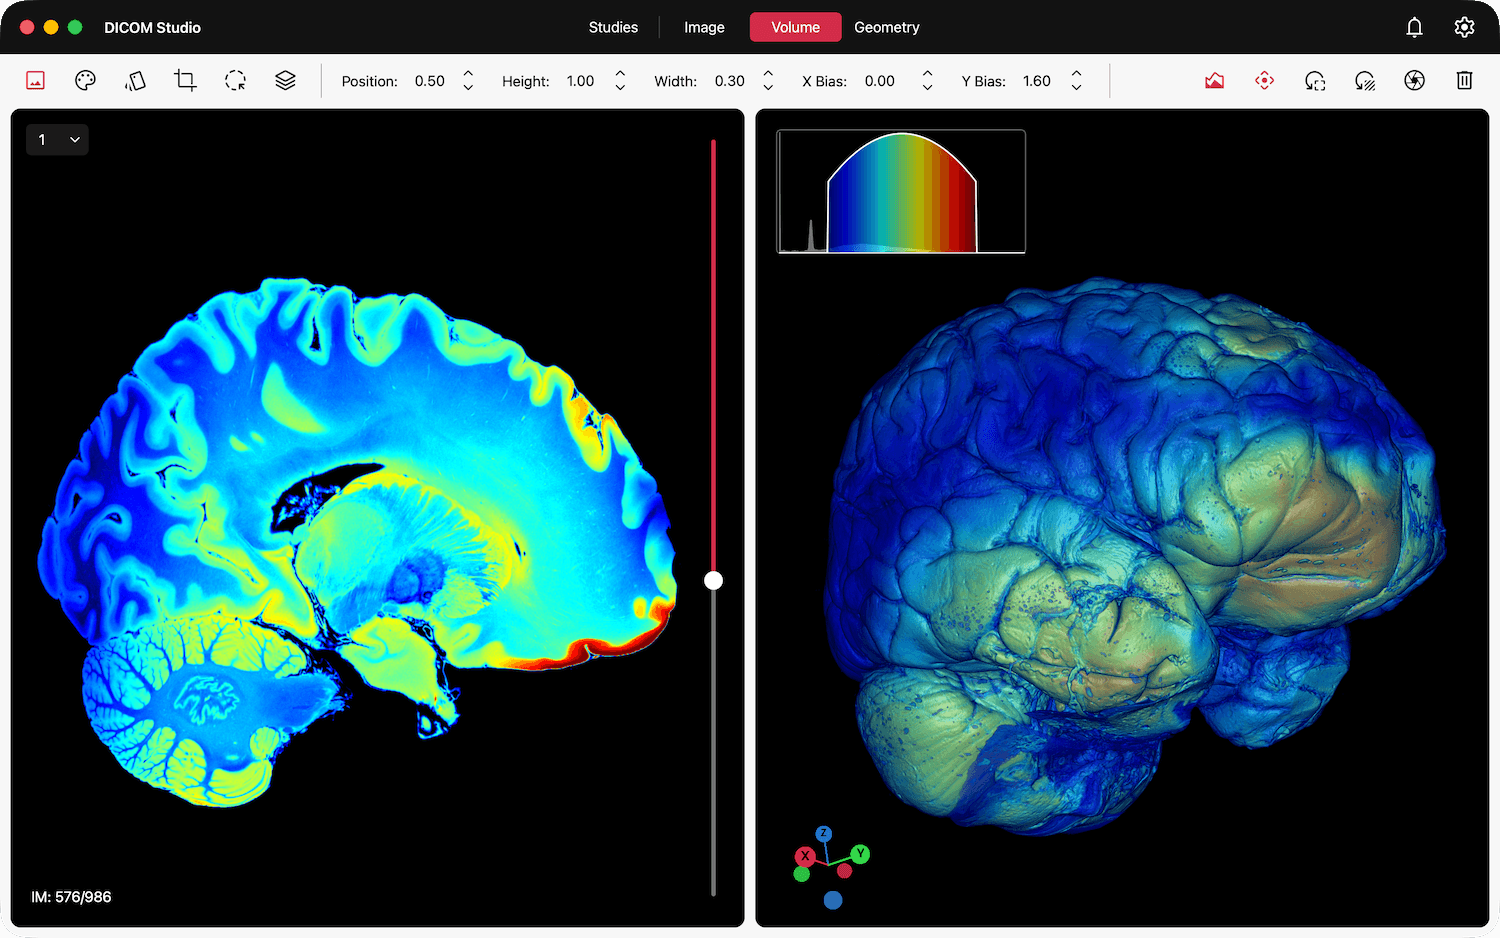
The Image View maintains all the widgets described in the 2D Imaging section, except for one. In place of the Fullscreen toggle, the Image View now has a drop-down menu in the top-left that allows you to alter the orientation of the slices.
Color Presets
Click the Apply Color Preset button in the toolbar, with the icon below.
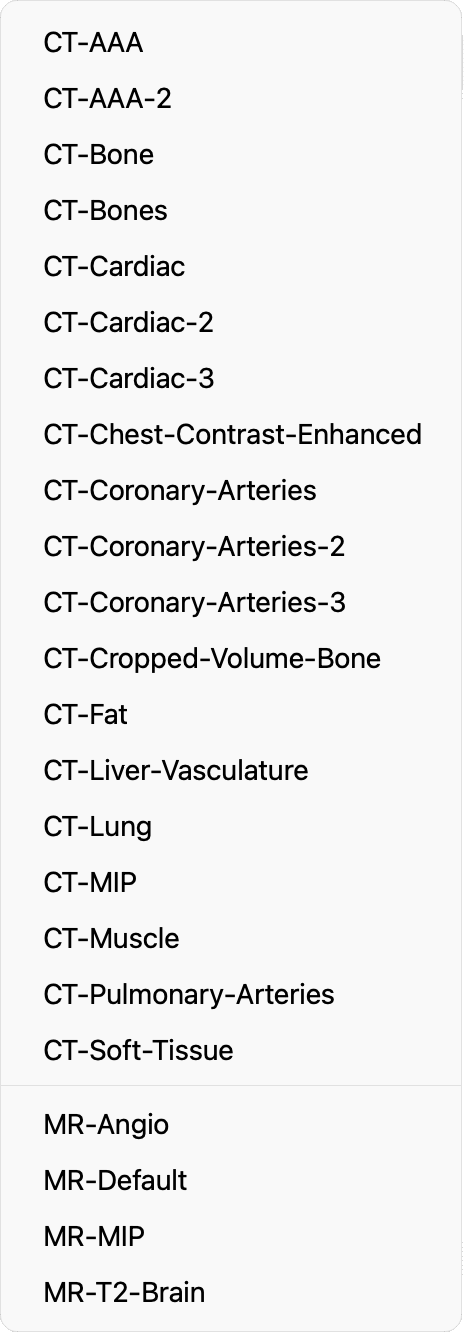
Pick a color preset from the menu that follows.
The colormap will instantly be applied to the volume.
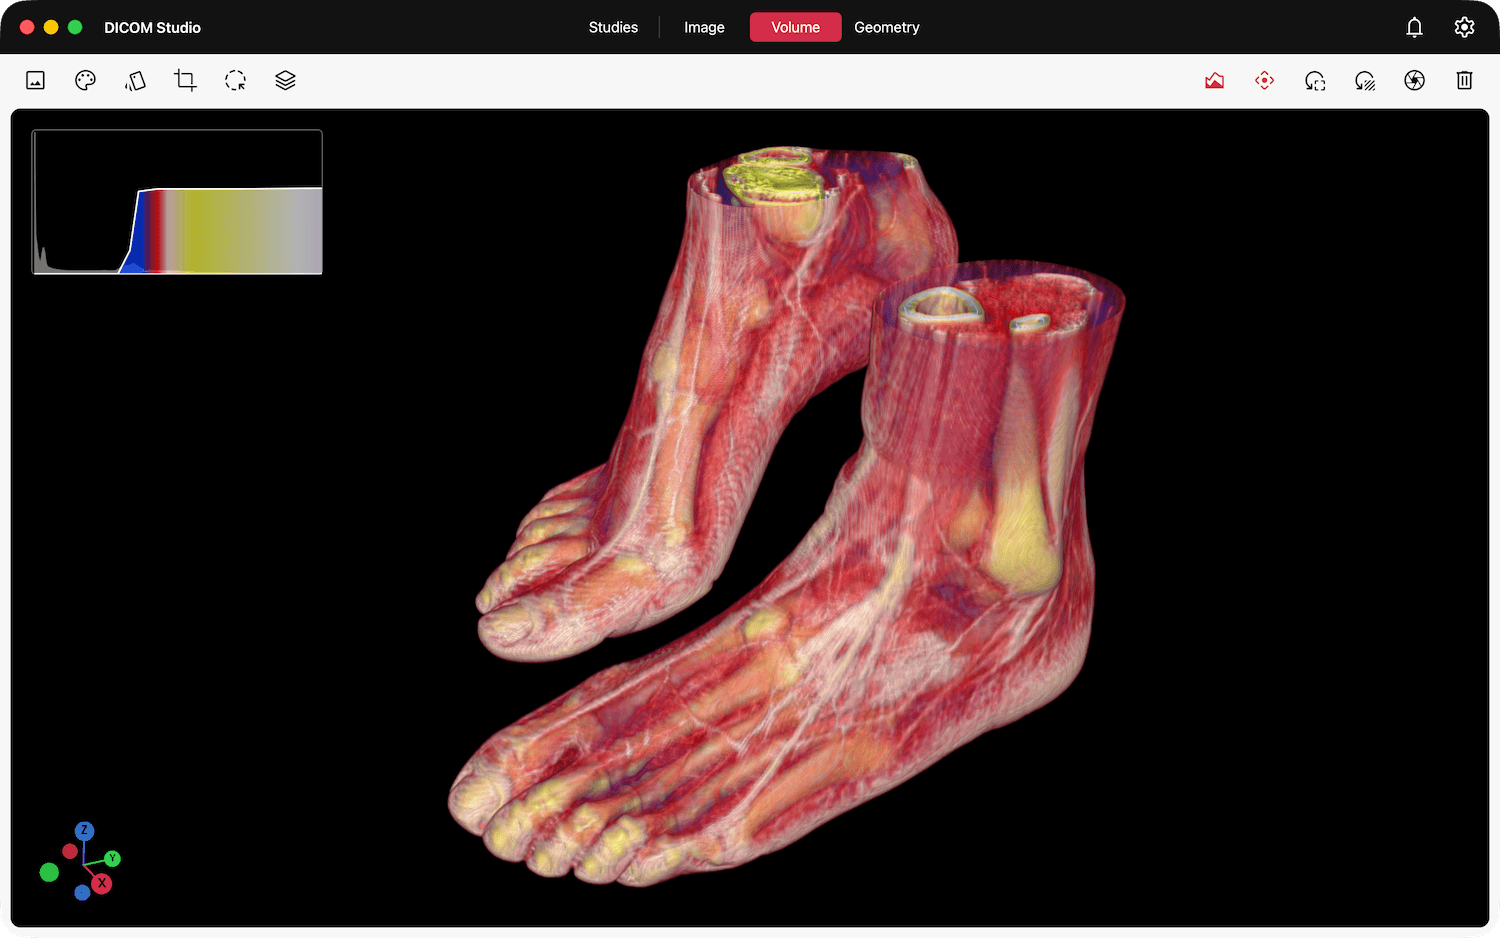
As the name suggests, Color Presets consist of predefined sets of values experimentally determined to visualize specific tissues and organs in CT and MRI Images. Many of the presets are named according to the regions of the human body that they are defined to visualize. A good start to get a general view of your dataset would be the CT-AAA or MRI-Default presets.
The main advantage of Color Presets over Adjustable Colormaps is speed. Presets are best suited for quick visualization, where you don't want to spend too much time working on refining a volume render.
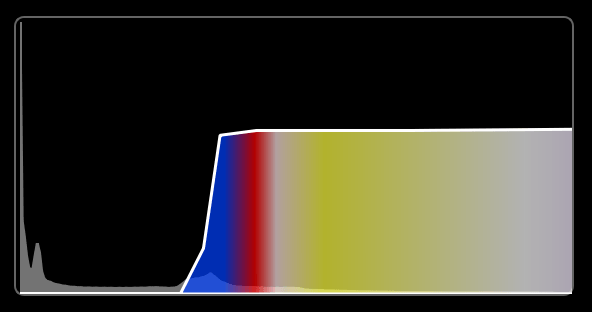
As with the adjustable colormaps, a Color • Opacity Distribution chart representing the active color preset will be applied to the graph widget in the top-left.
Toggle Graph Visibility
Use this tool to show/hide the graph widget.
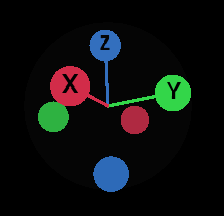
Orientation Widget
Use this tool to show/hide the orientation widget.
Reset Camera
The Volume View allows you to Rotate, Pan, Zoom In and Zoom Out. As you do this, you may want to quickly restore the volume in view to its original position and size. Use this tool to effect this.
Refer to the Interaction section to learn how these controls work on your device.
Reset Volume
In the next section, Crop Tools , we will cover tools that alter the volume's dataset. Use this tool to restore the original volume dataset, effectively undoing all your changes.
Capture Screenshots
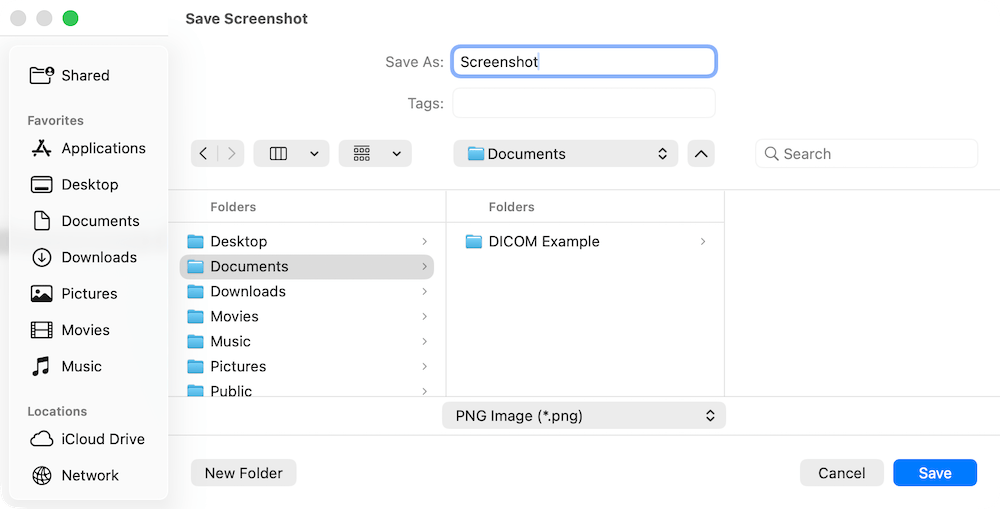
DICOM Studio supports the export of screenshots of the Volume View in either PNG or JPEG format. Click the Capture Screenshot button in the toolbar, with the icon above, and the dialog below will follow. Navigate to the location where you want to save the screenshot, enter it's name, select the image format and click save.
Remove Volume
This tool removes the volume in view. It also deactivates any tool previously active in the Volume tab. In effect, this resets the tab to a clean state.