Isosurface Creation
An isosurface is a 3D contour that connects all points in an image dataset where the pixel values match a target value. In DICOM Studio, given a minimum and maximum value, an isosurface will be created representing the areas in your dataset that fall within this threshold.
Click the Create Isosurface button in the toolbar, with the icon below.
Pick a pre-defined threshold from the menu that follows.
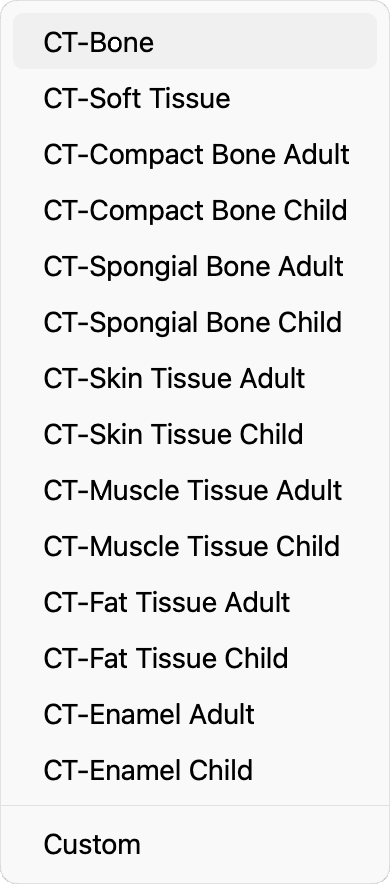
An isosurface will be created and added to the Geometry View.
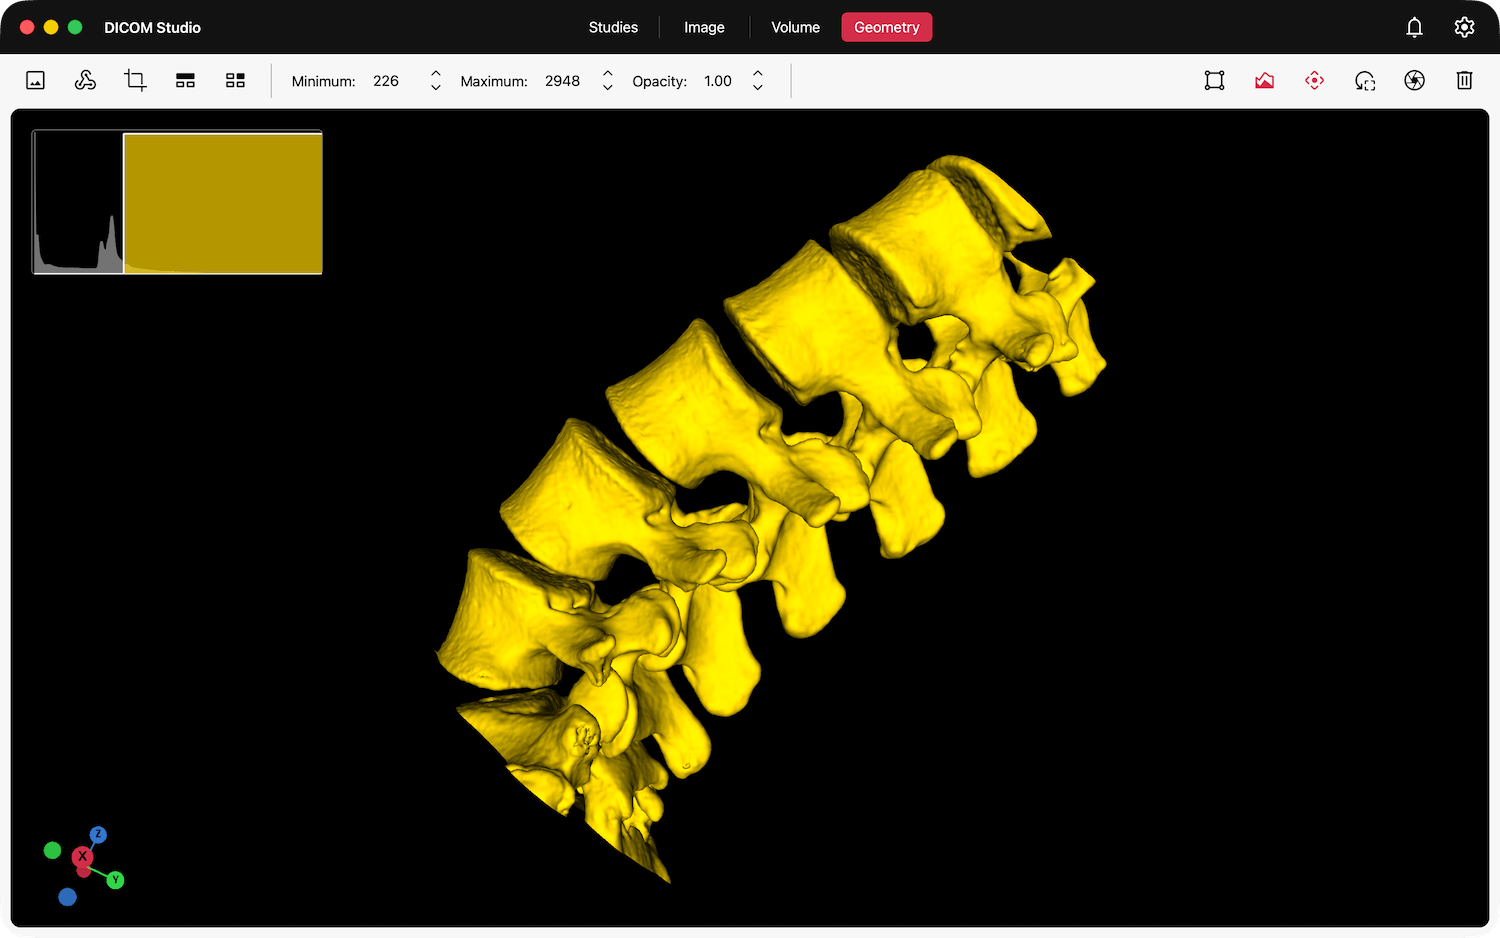
A Color Distribution chart will be added to the graph widget in the top-left. The color of this chart matches the color of the model in the Geometry View.
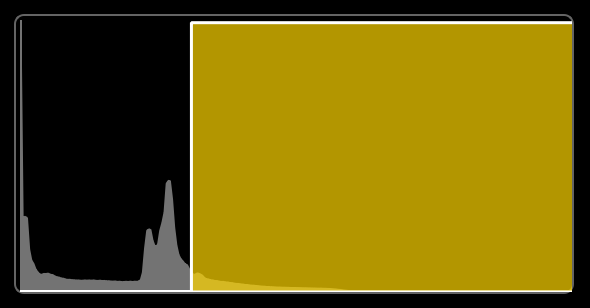
The graph also contains a histogram of the pixel values in your image dataset, represented by the light gray graph chart, just behind the bell curve. This histogram gives you a visual representation of the distribution of values in your dataset,and acts as a useful guide when adjusting the minimum and maximum threshold values.
Use the first two widgets below, found in the toolbar, to adjust the Minimum and Maximum values of the threshold applied. The third widget can be used to modify the Opacity of the model.

Changes to the threshold and opacity are calculated and displayed in real-time.
2D Image vs 3D Geometry View
Click the Show Image View button in the toolbar, with the icon above, to open an Image View side by side, next to the Geometry View. This allows you to directly compare your image dataset in 2D and 3D.
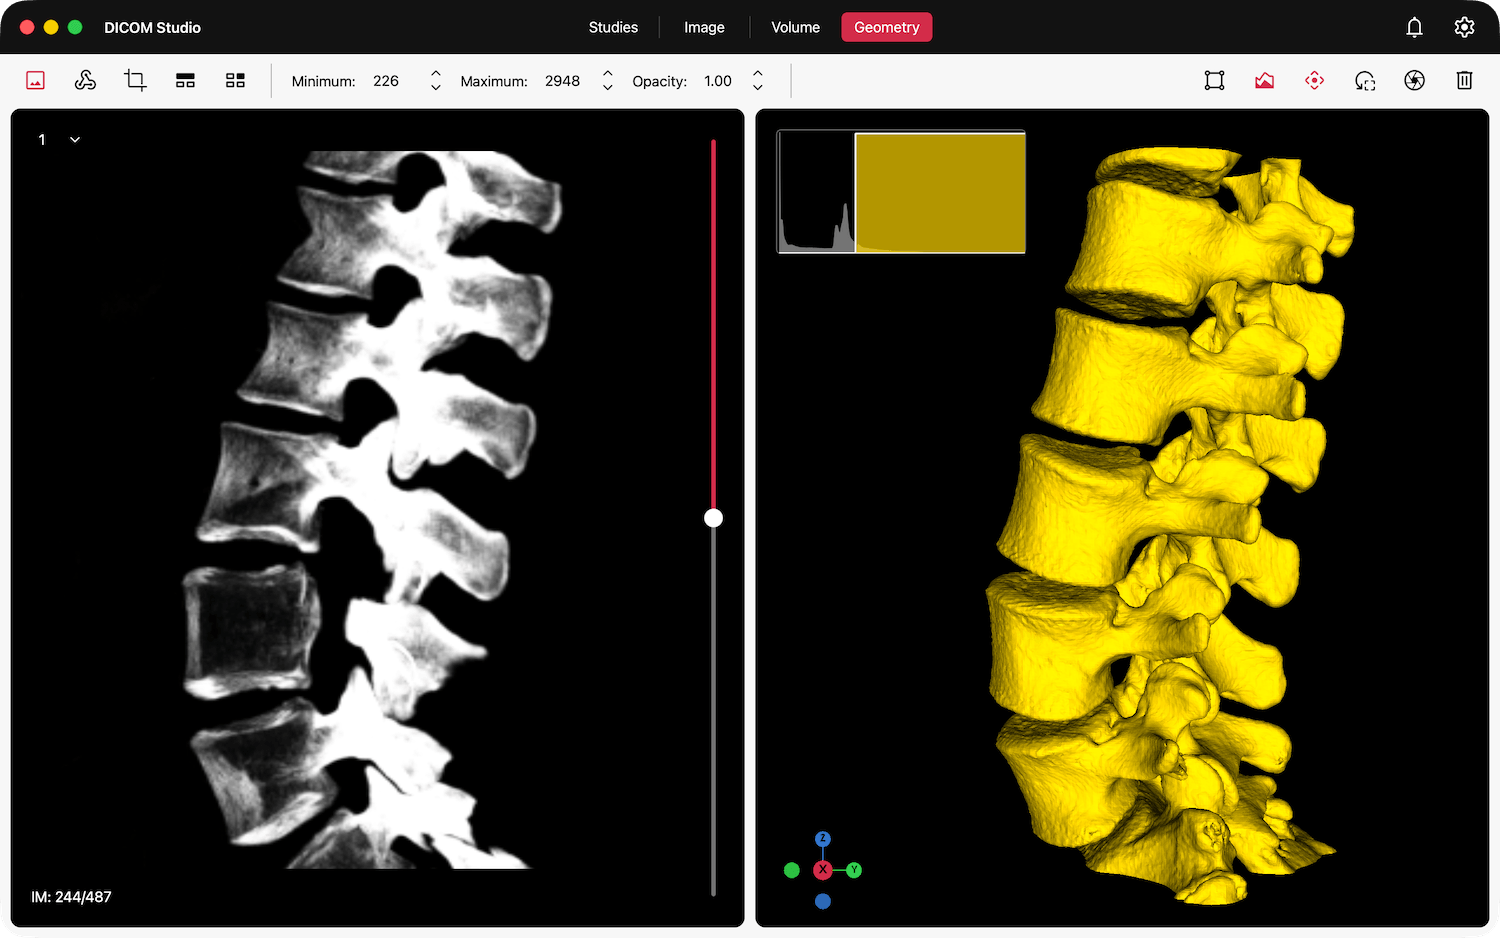
The Image View maintains all the widgets described in the 2D Imaging section, except for one. In place of the Fullscreen toggle, the Image View now has a drop-down menu in the top-left that allows you to alter the orientation of the slices.
Wireframe Mode
Activate this tool by clicking the Show Wireframe button in the toolbar, with the icon above. When active, this tool allows you to view the internal topology of the 3D model, peeling back the outer layer of the isosurface, revealing internal structures.
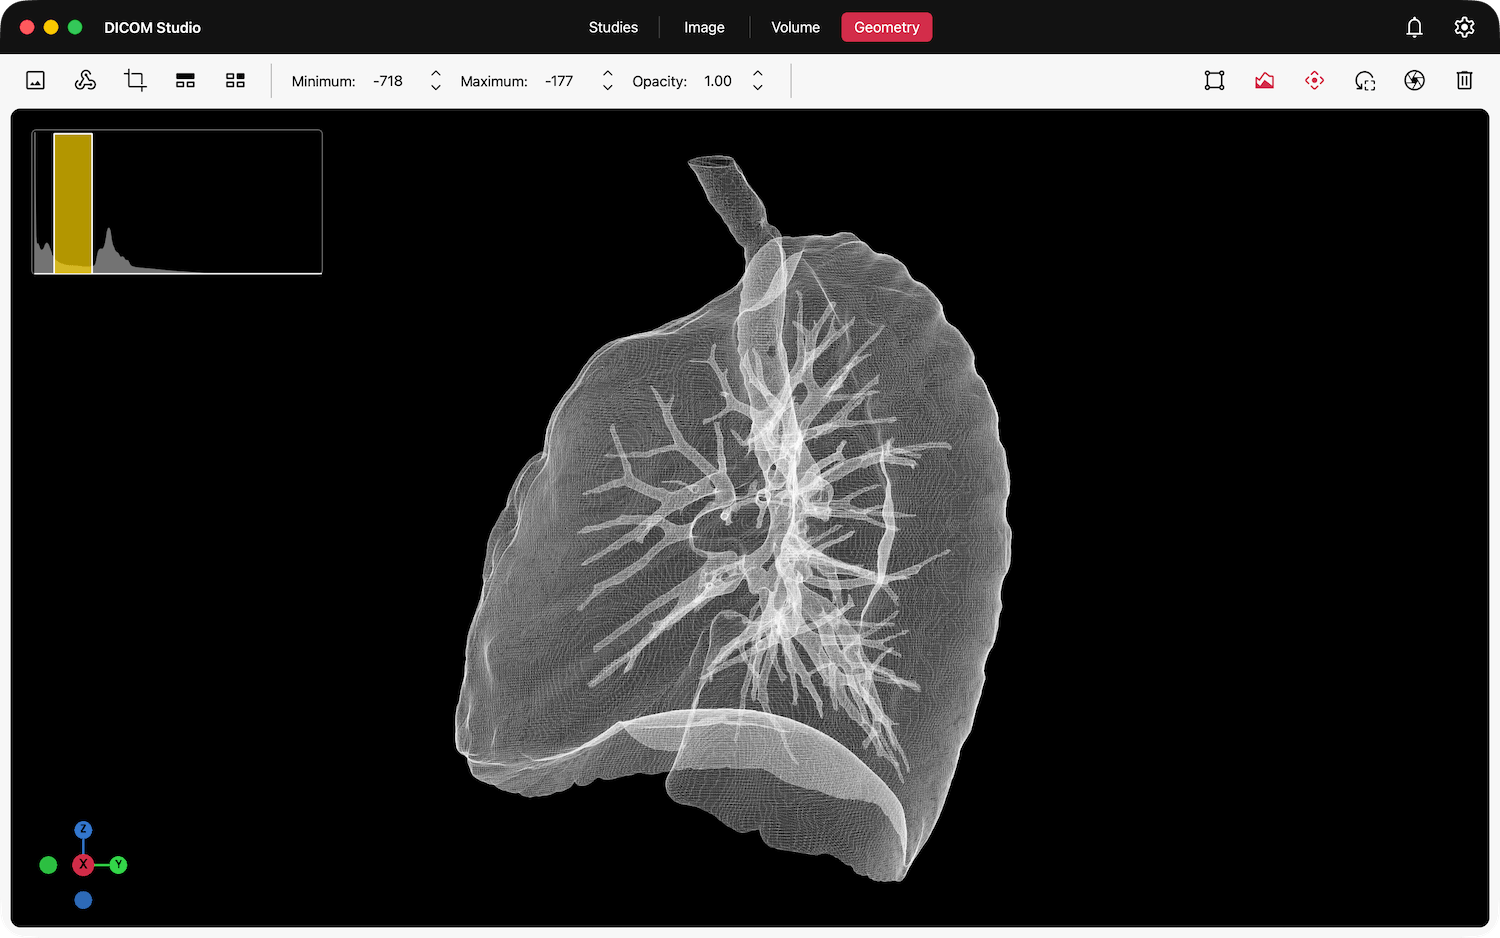
Click the Show Wireframe button once more to deactivate.
Toggle Graph Visibility
Use this tool to show/hide the graph widget.
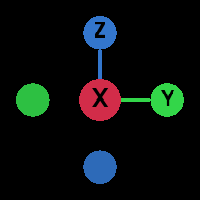
Orientation Widget
Use this tool to show/hide the orientation widget.
Reset Camera
The Geometry View allows you to Rotate, Pan, Zoom In and Zoom Out. As you do this, you may want to quickly restore the model in view to its original position and size. Use this tool to effect this.
Refer to the Interaction section to learn how these controls work on your device.
Capture Screenshots
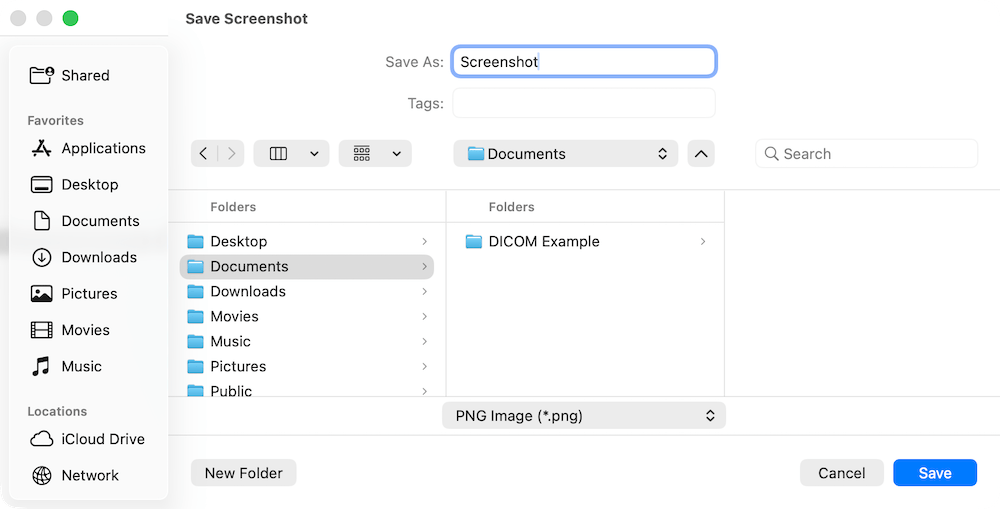
DICOM Studio supports the export of screenshots of the Geometry View in either PNG or JPEG format. Click the Capture Screenshot button in the toolbar, with the icon above, and the dialog below will follow. Navigate to the location where you want to save the screenshot, enter it's name, select the image format and click save.
Remove Model
This tool removes the model in view, deactivates all tools and resets the tab to a clean state.
Import and Export
You can export 3D models in STL Format. The STL (Stereolithography) format is one of the most popular formats for storage of 3D mesh files. Models in this format are stored as a collection of triangular facets only, describing surface geometry without any color, texture or material information. As a result, they typically have small file sizes. This simplicity makes it the most common format for 3D printing and manufacturing processes where only shape matters.
Save a 3D model on your device for external use from the menubar under the Geometry menu: Geometry → Export STL.
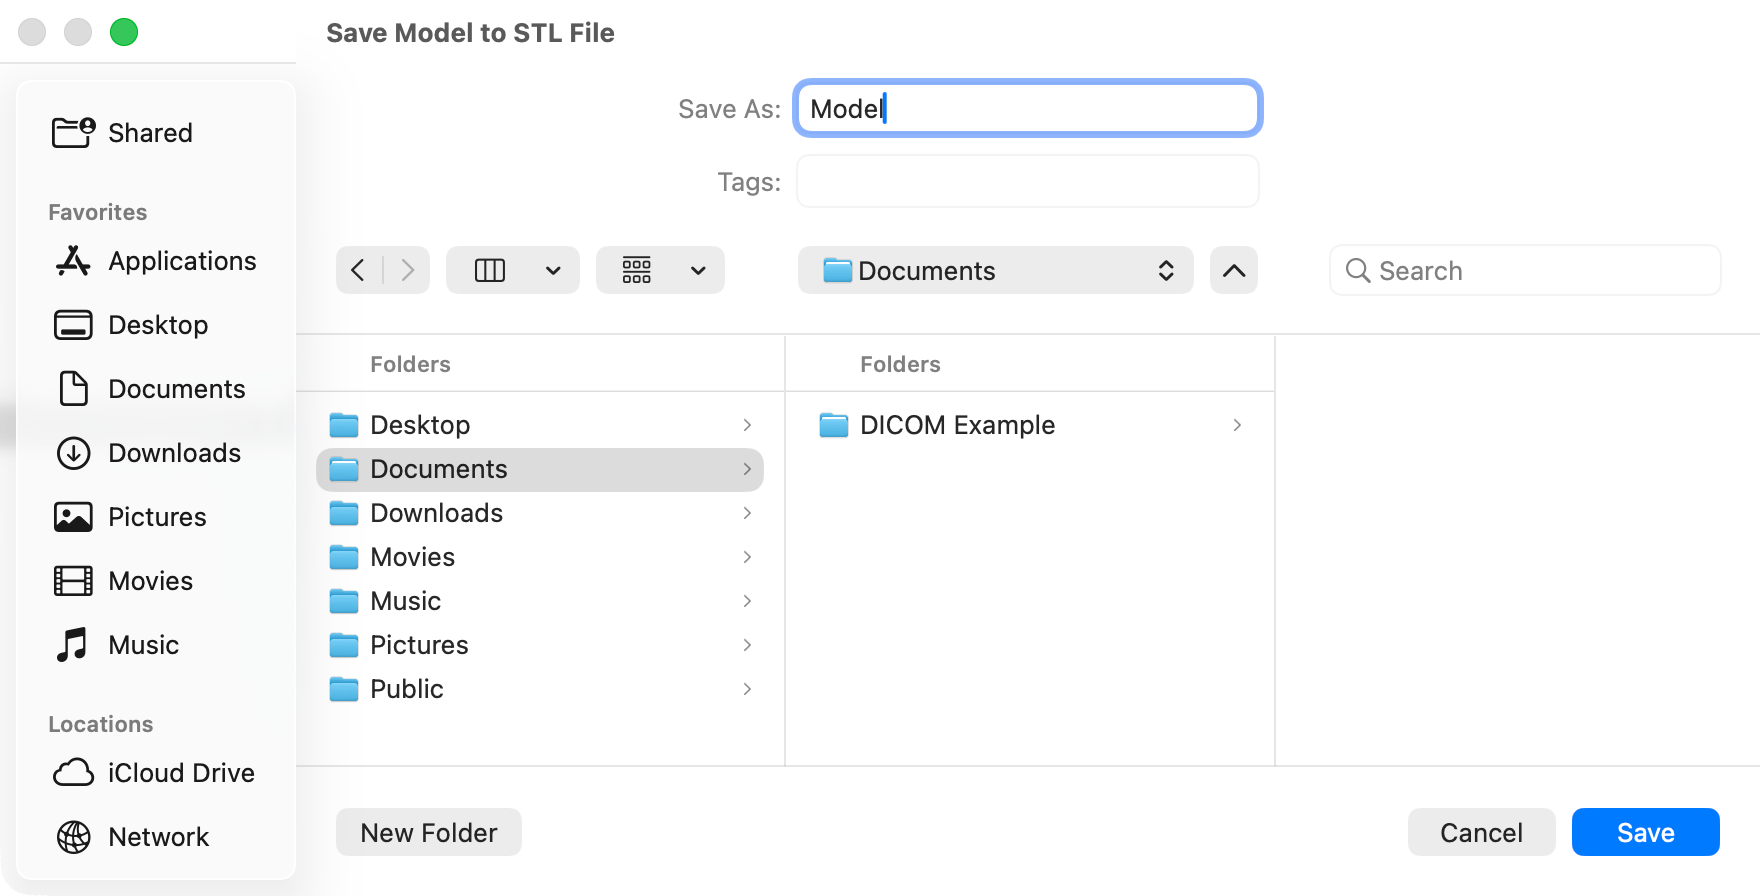
Navigate to the location where you want to export the model, enter it's name and save.
Conversely, you can also import external STL models from the menubar under the Geometry menu: Geometry → Import STL.
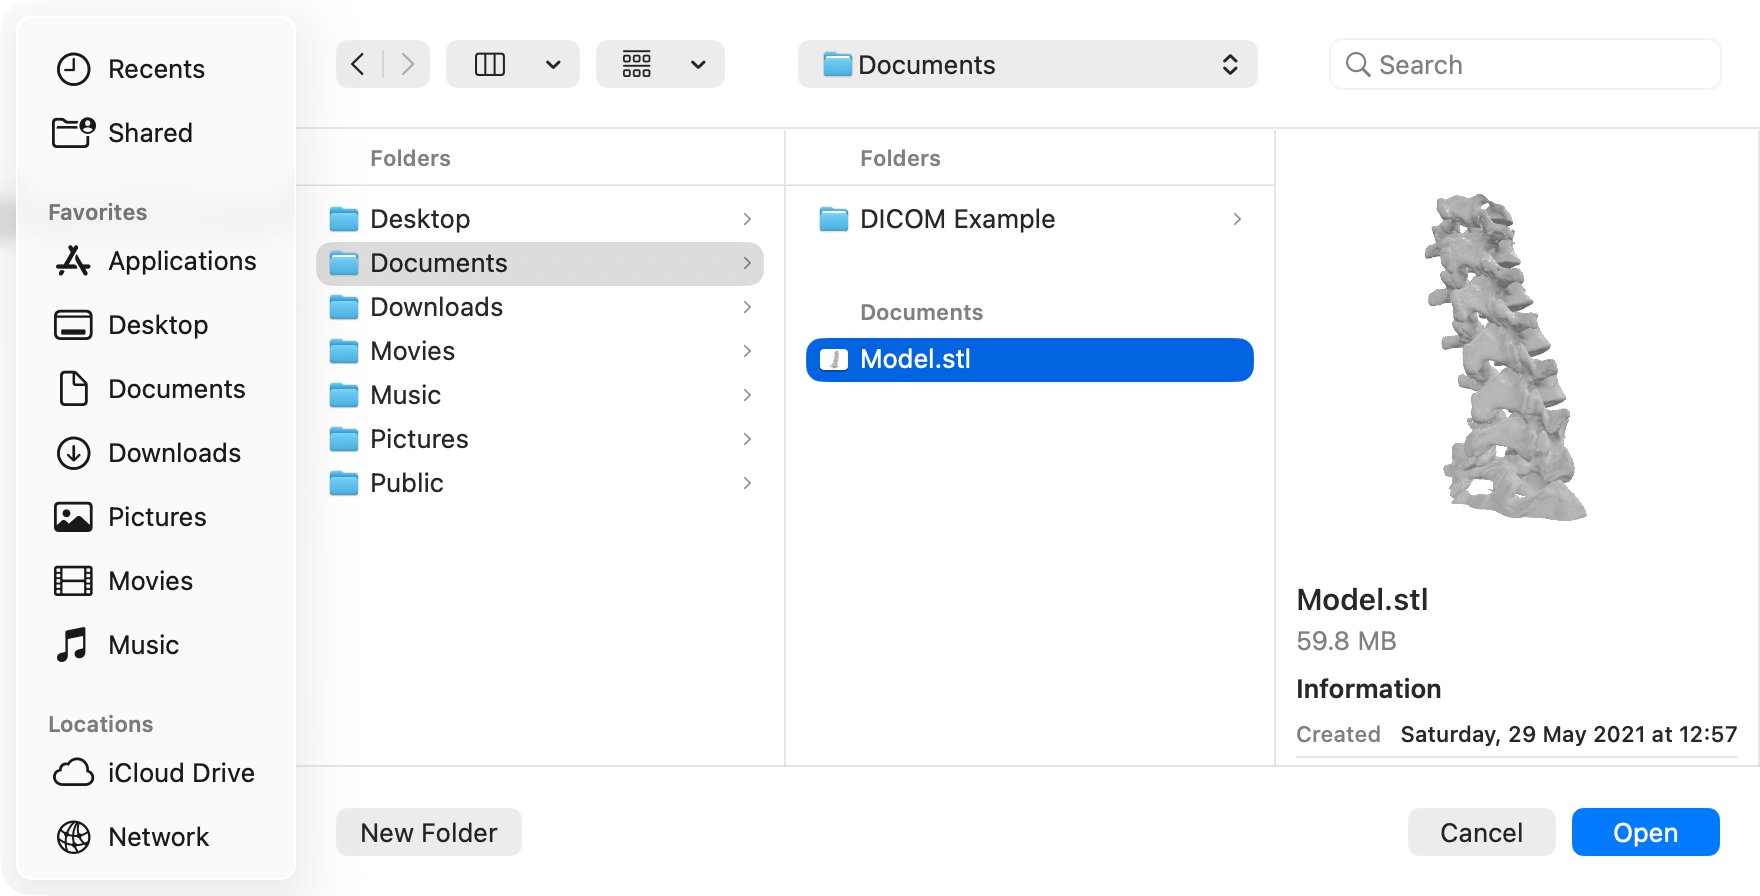
Navigate to the .stl file's location, select it and open.